A Guide to Debugging Code in Neovim
Every year I try to complete the Advent of Code challenge.
This year was no different but I chose to twist it up a little and pick C as my programming language.
Little did I know what I signed up for.
I started solving the problems and thinks went well until...
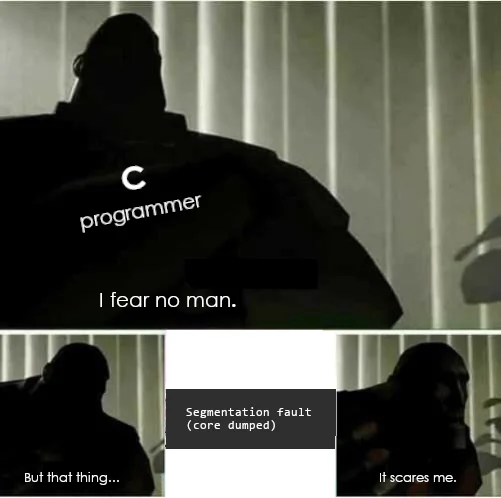
The problem with segmentation faults I can't really debug them by using printf So I had to go back to my toolbox and pick up a tool I hadn't used in a very long time and never with Neovim.
The debugger.
(cue crickets)
Anyway, Neovim is simply a text editor that doesn't have inherent debugging capabilities. But I know for a fact the Neovim community made it work and the answer unexpectedly came from Microsoft.
Debug Adapter Protocol (DAP)
As you all know Microsoft has been preaching open source since the day Steve Balmer left and Satya took over.
They brought us great things like VSCode and acquired companies like GitHub and NPM. They eased the development of language servers with the Langauge Server Protocol (LSP).
Inspired by the success of LSPs. Microsoft decided to do the same thing with debuggers. They introduced the Debug Adapter Protocol (DAP) in 2016. It's basically an open standard way of communicating between IDEs and debuggers.
Before DAP, every IDE had to implement its custom debugging experience tailored to a specific programming language. For example, if you were coding in Java back in the day, you had three main IDEs all with their custom debuggers:
- Eclipse
- IntelliJ IDEA
- NetBeans
DAP fixes this by standardizing debugging features (like breakpoints, stack traces, and variable inspection) are implemented, enabling any editor that supports the protocol to work with any debugger that implements it.
Configuring a Debugger in Neovim
Now that we know what DAP is, let's make it work in Neovim. Currently, there is no native implementation of DAP but thanks to the community we have nvim-dap which is the de facto standard for DAP support in Neovim.
Step 1: Installing our Plugins
Let's set it up first of all. I'll be using lazy as our package manager:
{
    "mfussenegger/nvim-dap",
    event = "VeryLazy",
    dependencies = {
        "rcarriga/nvim-dap-ui",
        "nvim-neotest/nvim-nio",
        "jay-babu/mason-nvim-dap.nvim",
        "theHamsta/nvim-dap-virtual-text",
    },
},
The dependencies are optional but I highly recommend having them. They significantly improve the debugging experience within Neovim.
The first dependency is nvim-dap-ui which gives you a nice UI while debugging. It looks something like this:
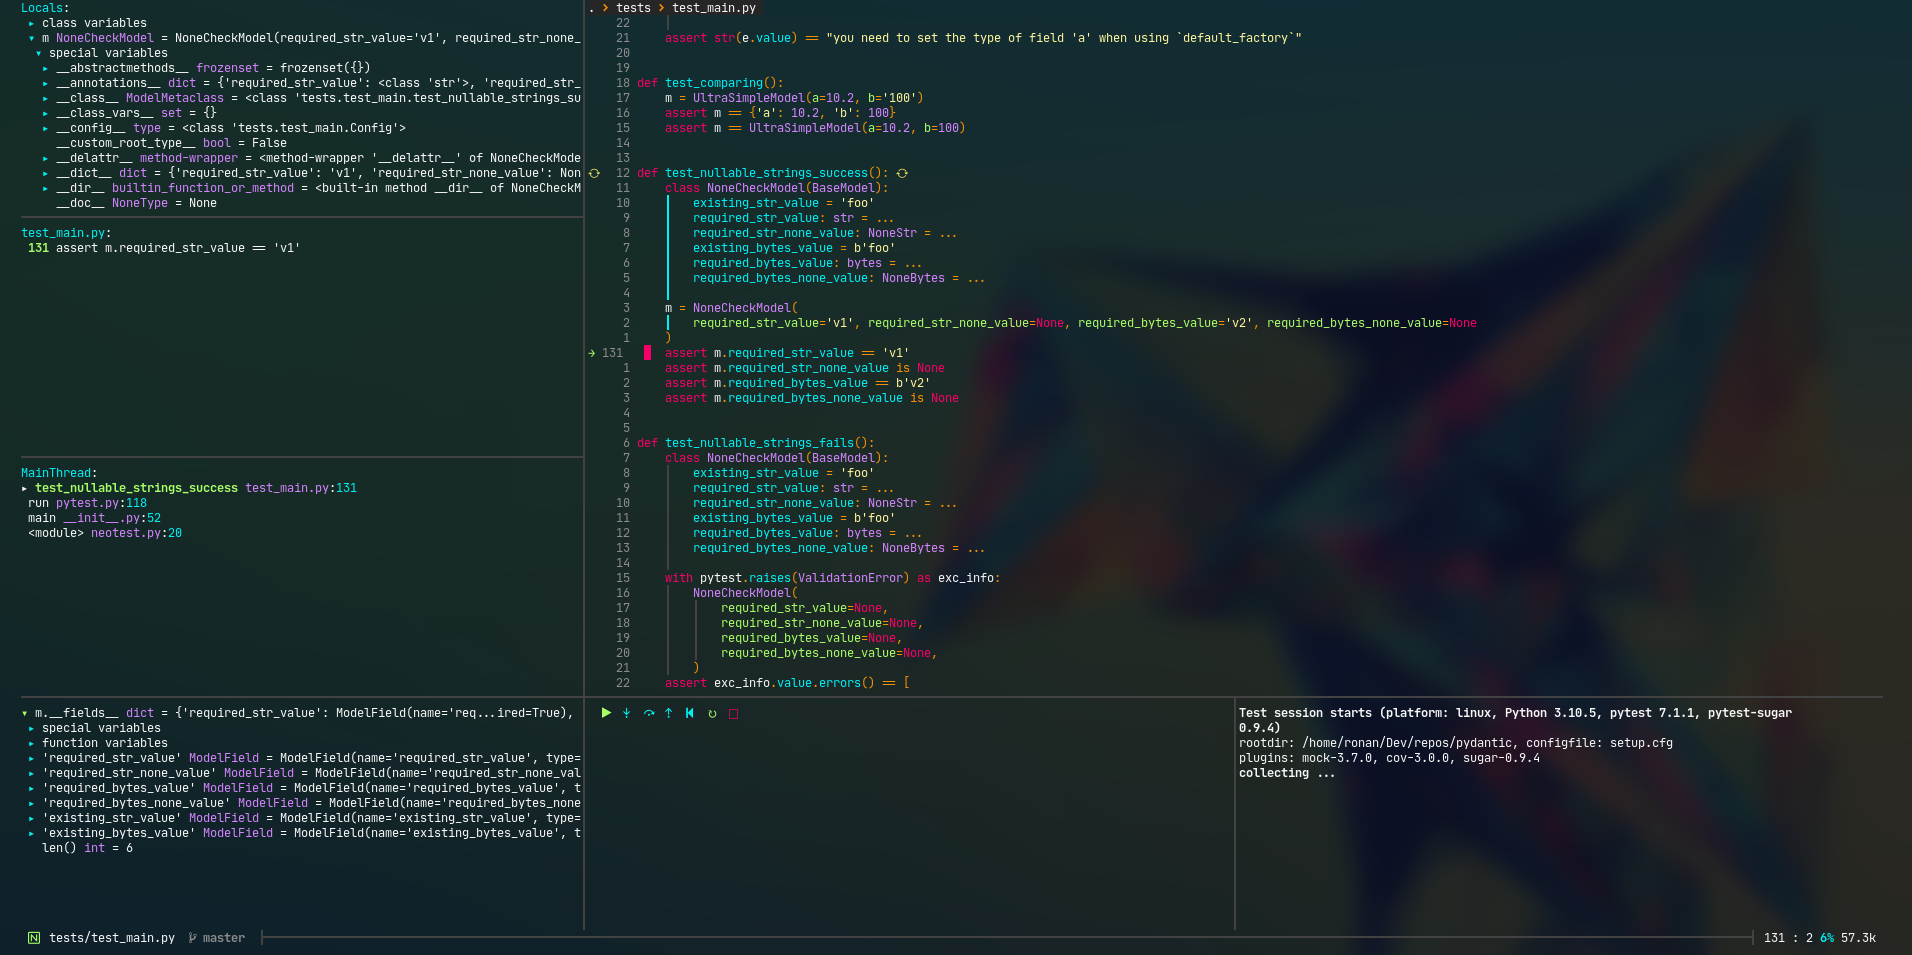
nvim-dap-ui documentation. It requires the package nvim-nio , so we add it to our dependencies. The next package is mason-nvim-dap.nvim which provides an easy way to install debuggers. But keep in mind it will only work if you already use mason.nvim
The last plugin, nvim-dap-virtual-text adds virtual text support to nvim-dap. It will show the values of your variables while your application is running. It looks something like this:

Step 2: Configuring the Plugins
Configuring our plugins is fairly simple as I don't really have anything custom apart from debugger configurations.
Here is my current configuration that supports C/C++ debugging:
local mason_dap = require("mason-nvim-dap")
local dap = require("dap")
local ui = require("dapui")
local dap_virtual_text = require("nvim-dap-virtual-text")

-- Dap Virtual Text
dap_virtual_text.setup()

mason_dap.setup({
	ensure_installed = { "cppdbg" },
	automatic_installation = true,
	handlers = {
		function(config)
			require("mason-nvim-dap").default_setup(config)
		end,
	},
})

-- Configurations
dap.configurations = {
	c = {
		{
			name = "Launch file",
			type = "cppdbg",
			request = "launch",
			program = function()
				return vim.fn.input("Path to executable: ", vim.fn.getcwd() .. "/", "file")
			end,
			cwd = "${workspaceFolder}",
			stopAtEntry = false,
			MIMode = "lldb",
		},
		{
			name = "Attach to lldbserver :1234",
			type = "cppdbg",
			request = "launch",
			MIMode = "lldb",
			miDebuggerServerAddress = "localhost:1234",
			miDebuggerPath = "/usr/bin/lldb",
			cwd = "${workspaceFolder}",
			program = function()
				return vim.fn.input("Path to executable: ", vim.fn.getcwd() .. "/", "file")
			end,
		},
	},
}

-- Dap UI

ui.setup()

vim.fn.sign_define("DapBreakpoint", { text = "🐞" })

dap.listeners.before.attach.dapui_config = function()
	ui.open()
end
dap.listeners.before.launch.dapui_config = function()
	ui.open()
end
dap.listeners.before.event_terminated.dapui_config = function()
	ui.close()
end
dap.listeners.before.event_exited.dapui_config = function()
	ui.close()
end
Let's break down this setup. I first import the plugins and initialize nvim-dap-virtual-text without any custom configurations.
The next plugin we configure is mason-nvim-dap. I only wanted to debug C/C++ applications at the time and didn't want to go through the hassle of installing the debuggers myself. So using the ensure_installed config, I added cppdbg to make sure that mason-nvim-dap downloads the debugger I need.
You can take a look at the debuggers that mason-nvim-dap supports here.
mason.nvim before mason-nvim-dapNext, I have specific configurations for debuggers. This is language and debugger-specific. I found this out from the nvim-dap documentation on C/C++. I have set it up to use lldb because I'm on an M1 Mac.
Finally, we have auto commands for nvim-dap-ui. This will automatically open up the UI whenever you start a debug session and close the UI once your session is done.
Step 3: Setting up Keymaps
The final thing we need to do is to set up our keymaps. Everyone has their own workflow but this is what works for me:
-- WhichKey Keymaps
{
  -- Debugger
  {
      "<leader>d",
      group = "Debugger",
      nowait = true,
      remap = false,
  },
  {
      "<leader>dt",
      function()
          require("dap").toggle_breakpoint()
      end,
      desc = "Toggle Breakpoint",
      nowait = true,
      remap = false,
  },
  {
      "<leader>dc",
      function()
          require("dap").continue()
      end,
      desc = "Continue",
      nowait = true,
      remap = false,
  },
  {
      "<leader>di",
      function()
          require("dap").step_into()
      end,
      desc = "Step Into",
      nowait = true,
      remap = false,
  },
  {
      "<leader>do",
      function()
          require("dap").step_over()
      end,
      desc = "Step Over",
      nowait = true,
      remap = false,
  },
  {
      "<leader>du",
      function()
          require("dap").step_out()
      end,
      desc = "Step Out",
      nowait = true,
      remap = false,
  },
  {
      "<leader>dr",
      function()
          require("dap").repl.open()
      end,
      desc = "Open REPL",
      nowait = true,
      remap = false,
  },
  {
      "<leader>dl",
      function()
          require("dap").run_last()
      end,
      desc = "Run Last",
      nowait = true,
      remap = false,
  },
  {
      "<leader>dq",
      function()
          require("dap").terminate()
          require("dapui").close()
          require("nvim-dap-virtual-text").toggle()
      end,
      desc = "Terminate",
      nowait = true,
      remap = false,
  },
  {
      "<leader>db",
      function()
          require("dap").list_breakpoints()
      end,
      desc = "List Breakpoints",
      nowait = true,
      remap = false,
  },
  {
      "<leader>de",
      function()
          require("dap").set_exception_breakpoints({ "all" })
      end,
      desc = "Set Exception Breakpoints",
      nowait = true,
      remap = false,
  },
}
which-key for my key map setup. Debugging Workflow with C/C++ Applications
Let's see how this actually works. The first thing one must do is compile their C/C++ application with the debug mode on.
I'll debug a file named main.c:
gcc main.c -g -o output.oNext in my editor, I'll add breakpoints with the keymap <leader> dt, it will look something like this:
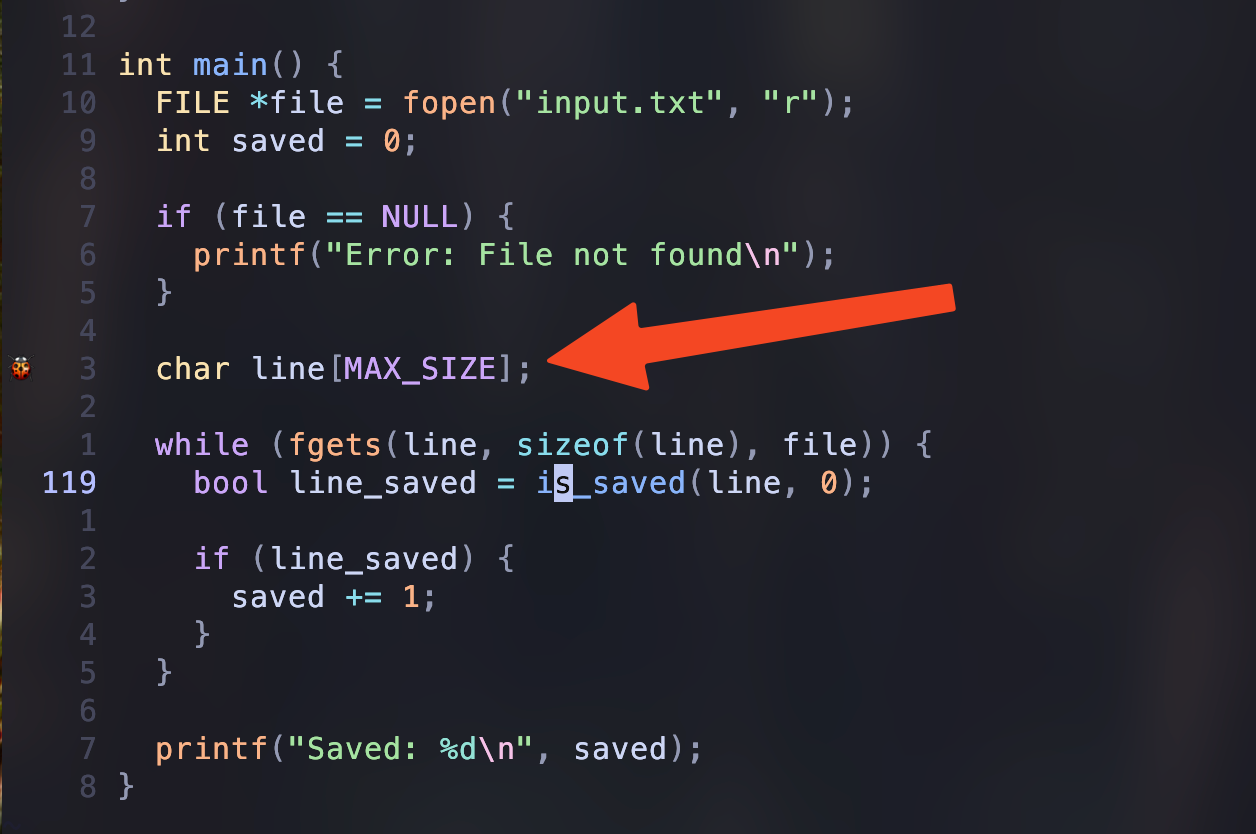
Once I have my breakpoint in place and want to start debugging, I use the keymap <leader> dc. It will ask if I want to run a file or attach the debugger to a process. If you remember this has all been specified in my C dap configurations.

I want to run the file we just outputted, so I pick option 1 and specify the name of our file, which is output.o.
My application starts running and conveniently stops at the breakpoint. My UI looks like this now:
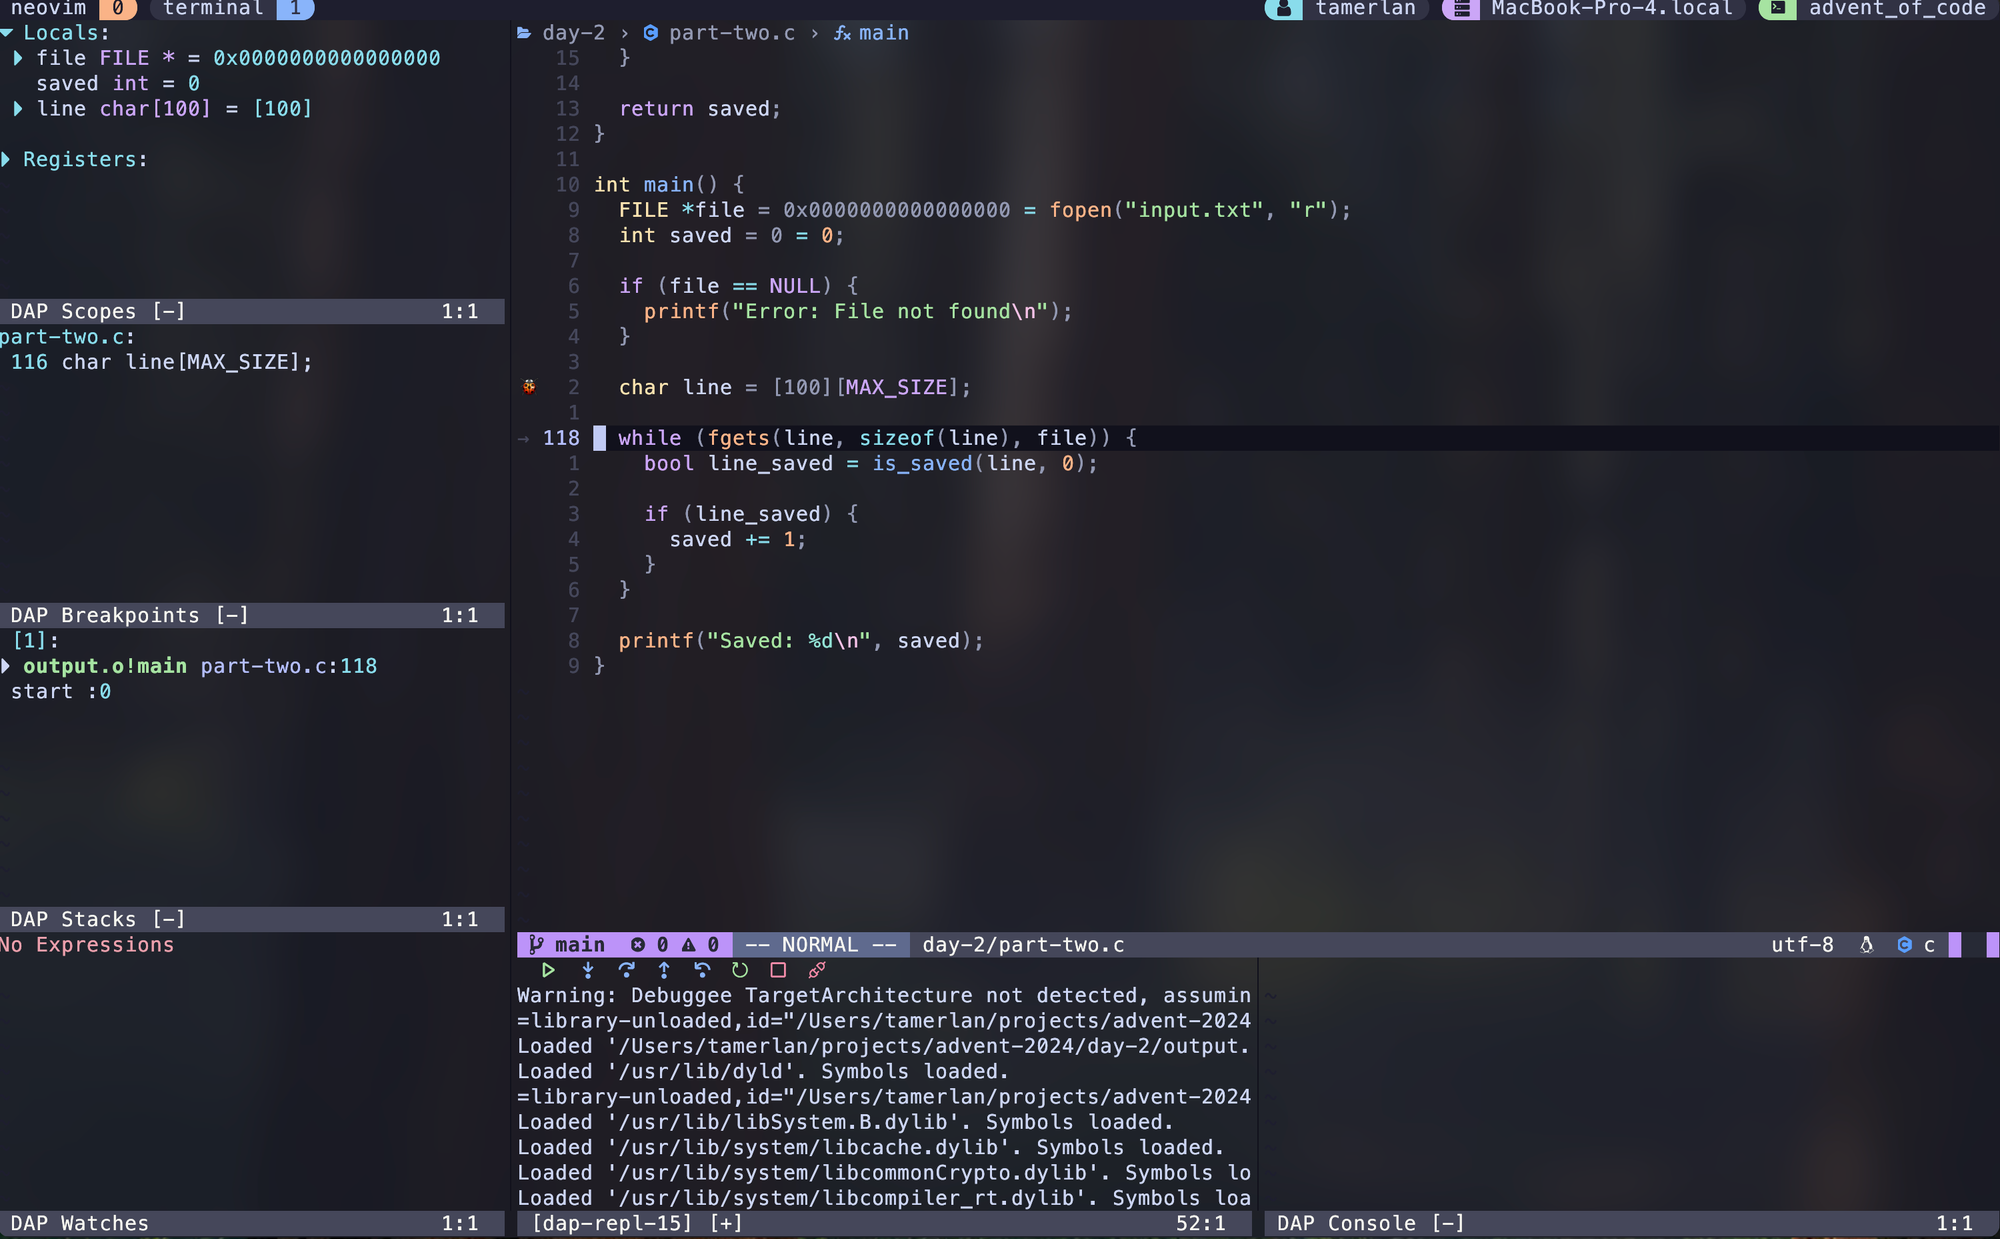
As you can see we have our virtual text working and I can either step in or out with the keymaps <leader> di or <leader> do.
Configuring Debuggers for Other Languages
Many of you reading this article aren't using C or C++, so I've added this section on how to set up debuggers for other programming languages.
Let's recap the general steps in setting up a debugger:
- Install the debugger using
mason-nvim-dapor directly through other means but ensure it's accessible via the terminal. - Add it to your DAP configuration.
Following this logic, let's set up debuggers for various popular programming languages.
Javascript Debugger
If we go back to the DAP docs, you'll see a section regarding installing debuggers for various programming languages.
The one we are interested in is the node-2 debugger. There are other ones but this is the only basic one I found that supports DAP and is found in mason-nvim-dap.
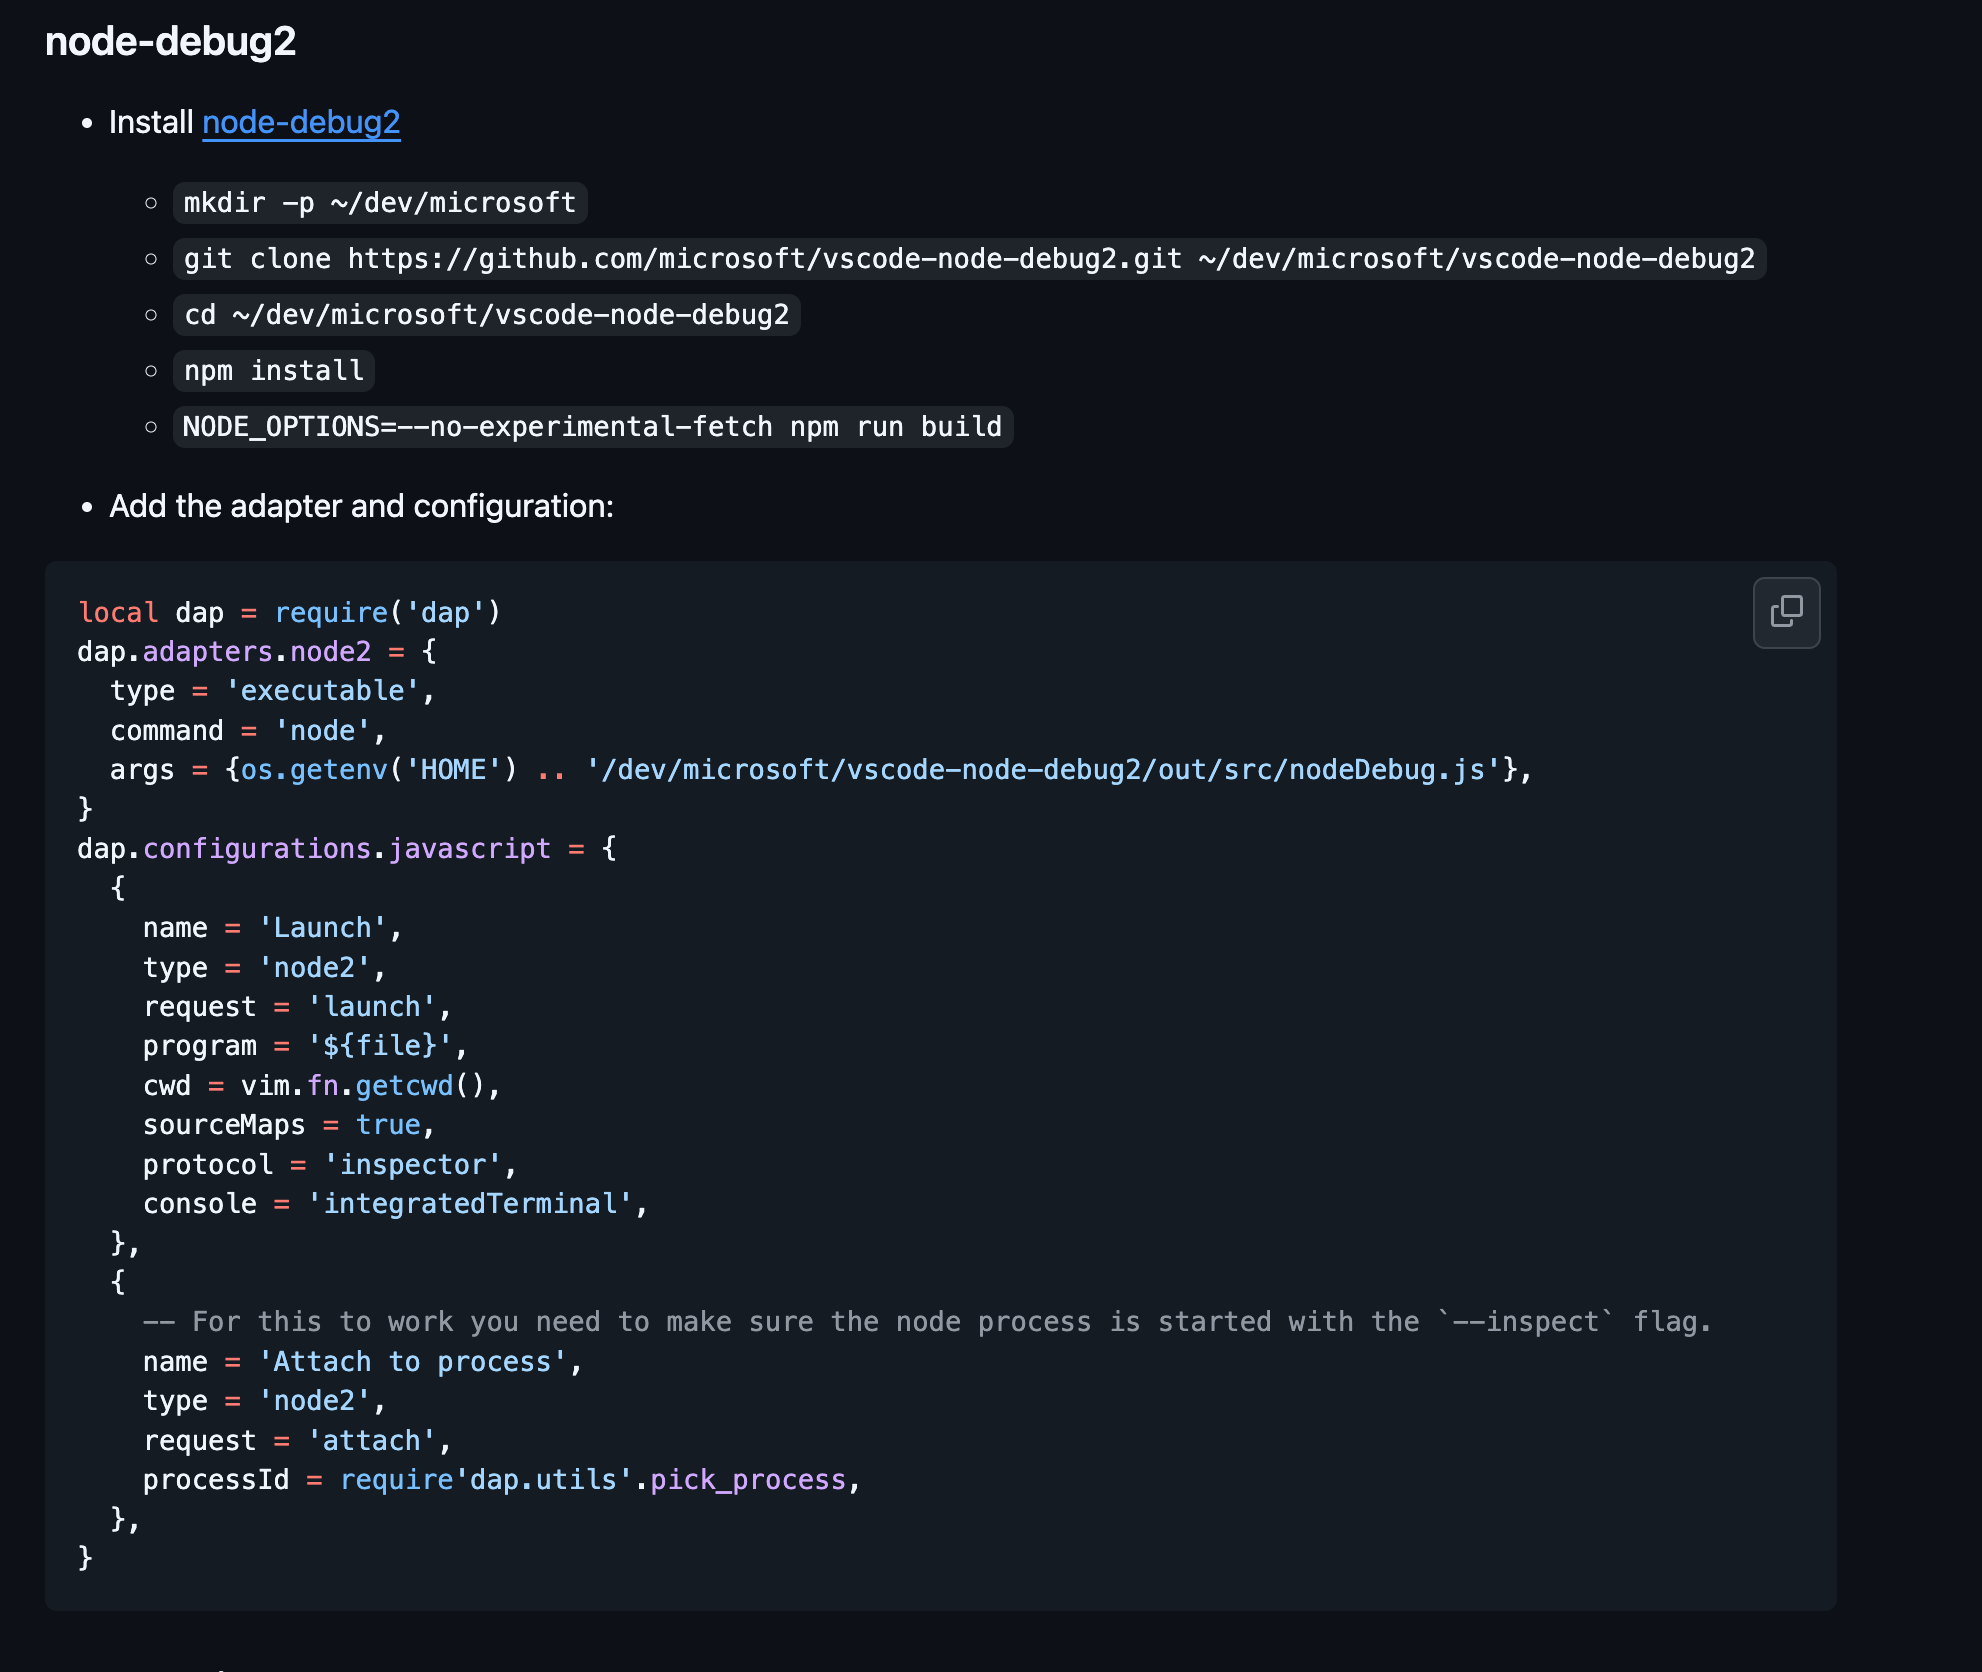
Step 1: Installing node-2
If we take a look at all the debuggers that mason-nvim-dap, we can see that node-2 is found in the list.
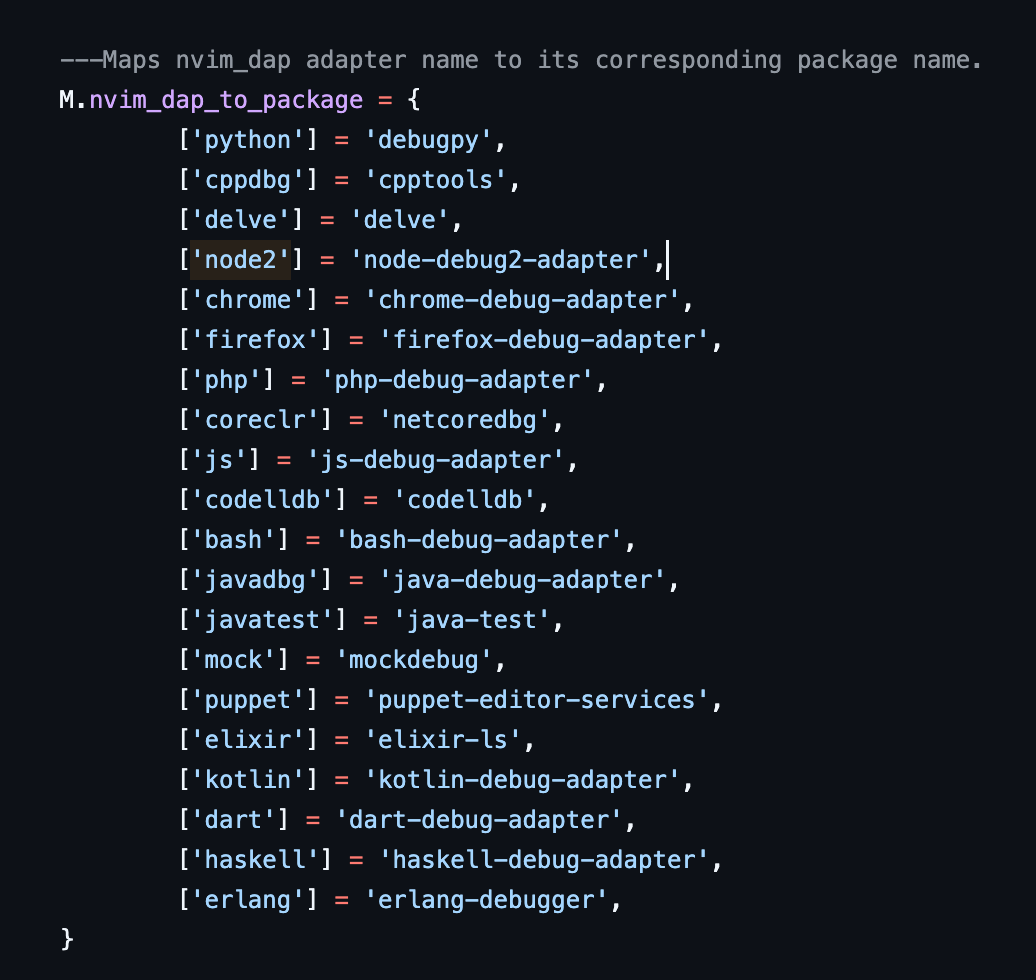
Let's add it to our ensure_installed, and restart neovim.
mason_dap.setup({
	ensure_installed = { "cppdbg", "node2" },
	automatic_installation = true,
	handlers = {
		function(config)
			require("mason-nvim-dap").default_setup(config)
		end,
	},
})
Once you restart neovim, you should see a message after a couple of seconds saying that node-debug2-adapter was successfully installed.

Step 2: Configuring node-2
The next step is to add configurations for our javascript files. We have to tell nvim-dap what launch options we want. This is the standard config, I took from the nvim-dap docs:
dap.configurations = {
    -- rest of configuration
	javascript = {
		{
			name = "Launch",
			type = "node2",
			request = "launch",
			program = "${file}",
			cwd = vim.fn.getcwd(),
			sourceMaps = true,
			protocol = "inspector",
			console = "integratedTerminal",
		},
		{
			-- For this to work you need to make sure the node process is started with the `--inspect` flag.
			name = "Attach to process",
			type = "node2",
			request = "attach",
			processId = require("dap.utils").pick_process,
		},
	},
}
Now you're ready to go and debug Node applications.
Python
The debugger we will use for Python is debugpy. Microsoft actively maintains it and is the main Python debugger in VSCode.
Step 1: Installing Debugpy
debugpy is supported by mason-nvim-dap, so let's add it to our ensure_installed:
mason_dap.setup({
	ensure_installed = { "cppdbg", "node2", "python" },
	automatic_installation = true,
	handlers = {
		function(config)
			require("mason-nvim-dap").default_setup(config)
		end,
	},
})
Once we restart Neovim, nvim-dap should install debugpy and show us the following message:

Step 2: Configuring Debugpy
The next step is we have to configure debugpy, I'm just gonna use the default configuration given by nvim-dap docs. You can copy the following code to your DAP configuration:
dap.configurations = {
	python = {
		{
			-- The first three options are required by nvim-dap
			type = "python", -- the type here established the link to the adapter definition: `dap.adapters.python`
			request = "launch",
			name = "Launch file",

			-- Options below are for debugpy, see https://github.com/microsoft/debugpy/wiki/Debug-configuration-settings for supported options

			program = "${file}", -- This configuration will launch the current file if used.
			pythonPath = function()
				-- debugpy supports launching an application with a different interpreter then the one used to launch debugpy itself.
				-- The code below looks for a `venv` or `.venv` folder in the current directly and uses the python within.
				-- You could adapt this - to for example use the `VIRTUAL_ENV` environment variable.
				local cwd = vim.fn.getcwd()
				if vim.fn.executable(cwd .. "/venv/bin/python") == 1 then
					return cwd .. "/venv/bin/python"
				elseif vim.fn.executable(cwd .. "/.venv/bin/python") == 1 then
					return cwd .. "/.venv/bin/python"
				else
					return "/usr/bin/python"
				end
			end,
		},
	},
}
Congratulations, now you're ready to go and debug Python applications.
Go Debugger
For Golang, we will use delve as our debugger of choice. It's supported by mason-nvim-dap so the installation process should be the same as the previous languages.
Step 1: Installing Delve
Let's add delve to our ensure_installed config:
mason_dap.setup({
	ensure_installed = { "cppdbg", "node2", "python", "delve" },
	automatic_installation = true,
	handlers = {
		function(config)
			require("mason-nvim-dap").default_setup(config)
		end,
	},
})
Once we restart Neovim, nvim-dap should install delve and show us the following message:

Step 2: Configuring Delve
If I go back to the Go debugging documentation in nvim-dap docs, I can see that they have some default configurations that we can use:
dap.configurations = {
	go = {
		{
			type = "delve",
			name = "Debug",
			request = "launch",
			program = "${file}",
		},
		{
			type = "delve",
			name = "Debug test", -- configuration for debugging test files
			request = "launch",
			mode = "test",
			program = "${file}",
		},
		-- works with go.mod packages and sub packages
		{
			type = "delve",
			name = "Debug test (go.mod)",
			request = "launch",
			mode = "test",
			program = "./${relativeFileDirname}",
		},
	},
}
Congratulations, you're now ready to go and debug Go applications.
Configuring a Custom Debugger
For the final example, I wanted to show you guys how to configure debuggers not found within mason-nvim-dap.
The steps are similar to the ones above but the only difference is that we will have to install the debugger manually.
For this example, I'll be using the local Lua debugger. It's not available through mason-nvim-dap so let's do it the manual way.
Step 1: Installing local-lua-debugger-vscode manually
Depending on your operating system, there are multiple ways of installing a debugger. Either you build it from source or install it from a package manager.
For our local-lua-debugger-vscode, I didn't find any way to install it from a package manager but I suspect you can install it from VSCode and somehow get the path for that.
But anyhow, I will build it from source by running the following commands:
git clone https://github.com/tomblind/local-lua-debugger-vscode
cd local-lua-debugger-vscode
npm install
npm run build
Step 2: Configuring local-lua-debugger-vscode
The first thing we have to do is to add local-lua-debugger-vscode as an adapter, we do this with the following:
-- Adapters
dap.adapters["local-lua"] = {
	type = "executable",
	command = "node",
	args = {
		"/Users/tamerlan/projects/local-lua-debugger-vscode/extension/debugAdapter.js",
	},
	enrich_config = function(config, on_config)
		if not config["extensionPath"] then
			local c = vim.deepcopy(config)
			-- 💀 If this is missing or wrong you'll see
			-- "module 'lldebugger' not found" errors in the dap-repl when trying to launch a debug session
			c.extensionPath = "/Users/tamerlan/projects/local-lua-debugger-vscode/"
			on_config(c)
		else
			on_config(config)
		end
	end,
}
This tells nvim-dap that there is an adapter named local-lua. It's an executable node command, so that's why we link it to a debugAdapter.js file.
Next, let's add some actual Lua configuration:
-- Configurations
dap.configurations = {
	lua = {
		{
			name = "Current file (local-lua-dbg, lua)",
			type = "local-lua",
			repl_lang = "lua",
			request = "launch",
			cwd = "${workspaceFolder}",
			program = {
				lua = "luajit",
				file = "${file}",
			},
			args = {},
		},
		{
			name = "Current file (local-lua-dbg, neovim lua interpreter with nlua)",
			type = "local-lua",
			repl_lang = "lua",
			request = "launch",
			cwd = "${workspaceFolder}",
			program = {
				lua = "nlua",
				file = "${file}",
			},
			args = {},
		},
	},
}
Congratulations, you have now learned how to manually install and configure debuggers in Neovim.
Conclusion
See, that wasn't so hard. It took a bit of time but now you have a proper debugging set-up in Neovim.
But don't let this deter you away from other IDEs. If you like debugging in VSCode/Jetbrains/etc... then continue to do so. There's no right or wrong way of doing things.
Anyway, I hope you found this article useful. If you have any questions then feel free to leave them in the comments and I'll try to help you as much as I can.
Thank you for reading.
No spam, no sharing to third party. Only you and me.

Member discussion