An Introduction to DORA Metrics

Why should we care about metrics?
Because it tells us whether we are moving forward or backwards.
In the world of DevOps, we use the DORA metrics.
That's what we will talk about today.
Today you will learn:
- What are DORA metrics?
- Why do we need them?
- The benefits of tracking DORA metrics.
- The challenges of DORA metrics.
What are DORA metrics?
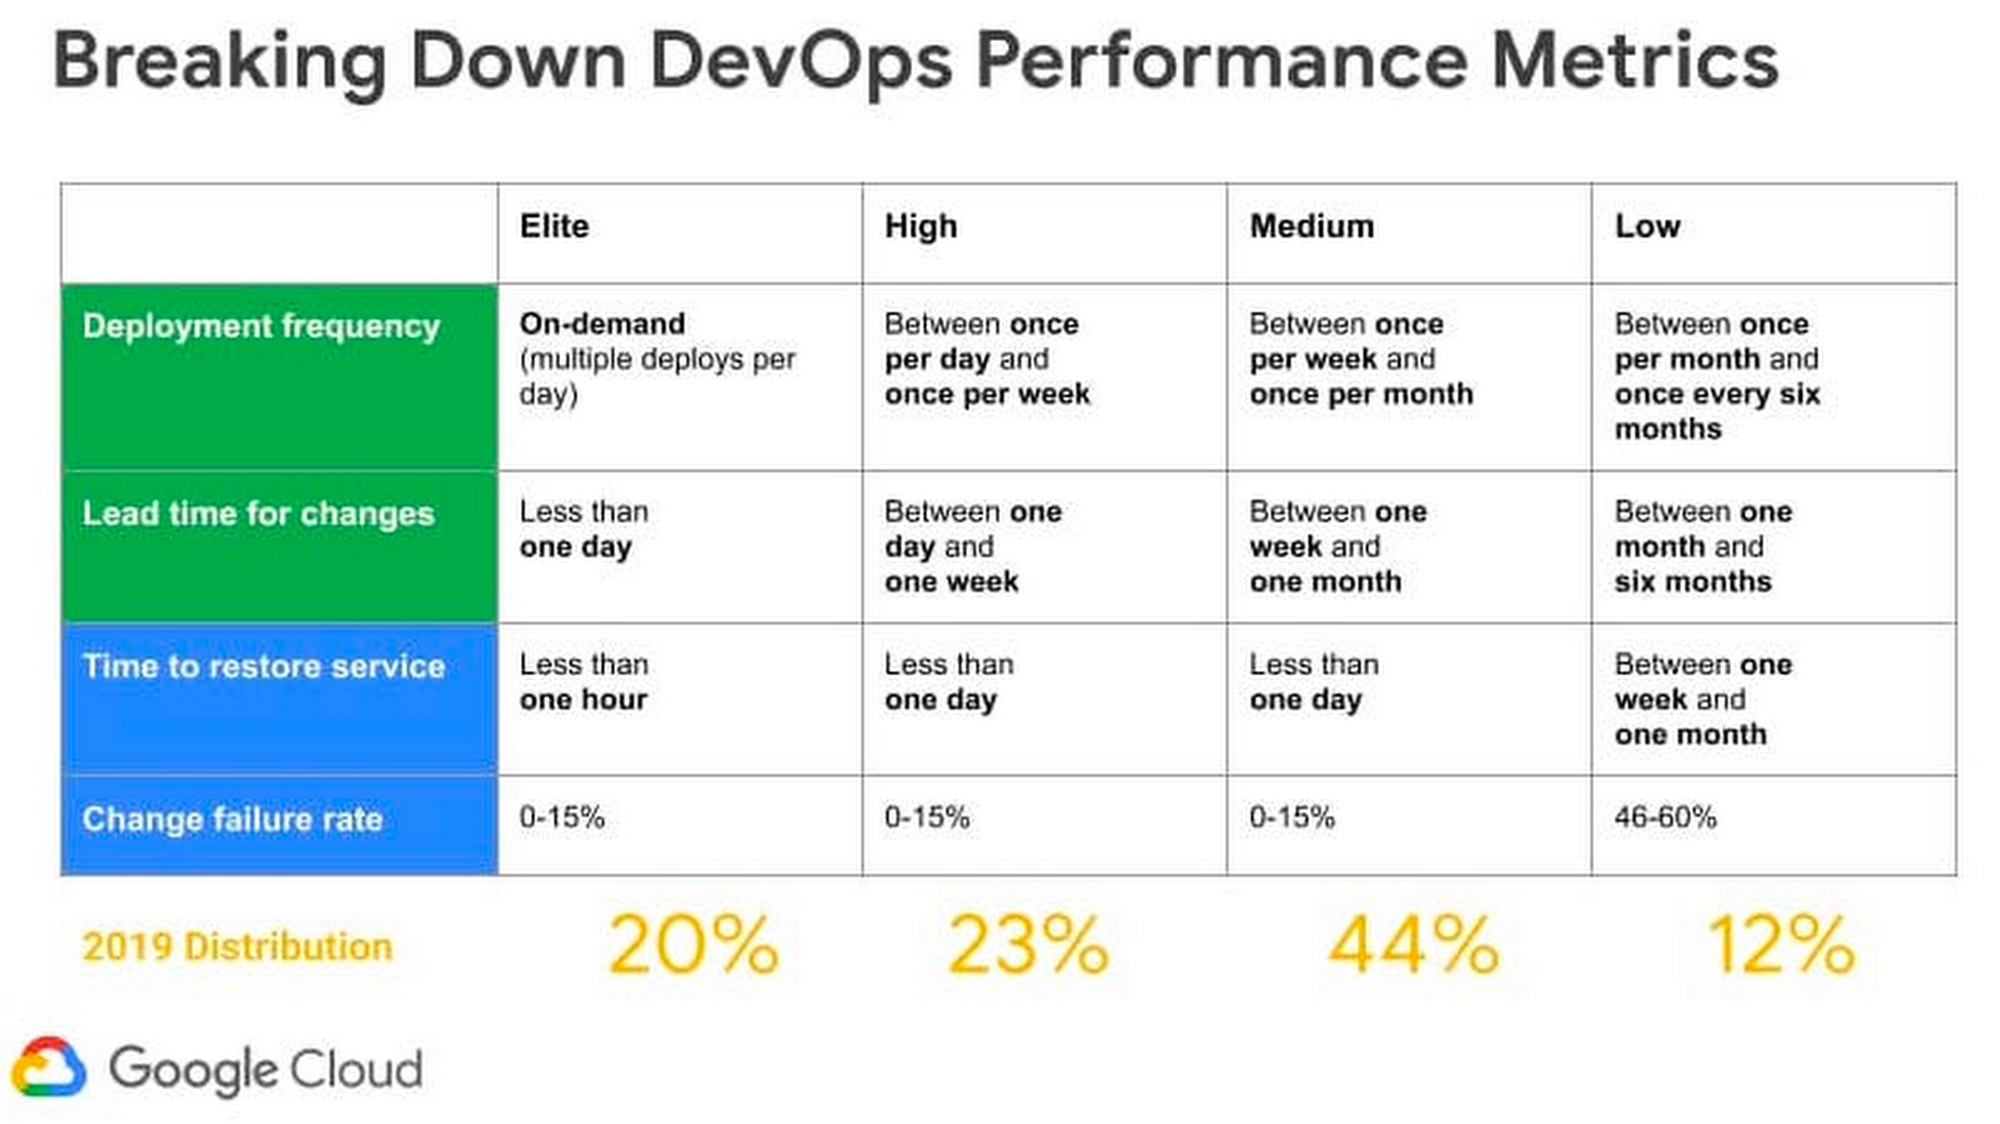
DORA metrics are metrics used to measure the performance of DevOps teams.
Temas are ranked from "low performers" to "elite performers".
It was developed at Google, within a seven-year project that analyzed DevOps practices and capabilities. It has identified four key metrics to measure the performance of software teams.
The four metrics are:
- Deployment Frequency – The frequency of successful software releases to production.
- Lead Time for Changes – The time between a commit and its deployment.
- Mean Time to Recovery – The time between a failure is detected and its full recovery. This is not only related to failures but to any interruptions due to deployment.
- Change Failure Rate – The rate at which the team's hotfixes or changes lead to failure after code has been deployed.
This work has revolutionized the DevOps world because it created visibility and delivered actual data that can be used as a base for improvements and data-driven decisions.
In the following sections, we will take a closer look at each of the four metrics.
Deployment Frequency
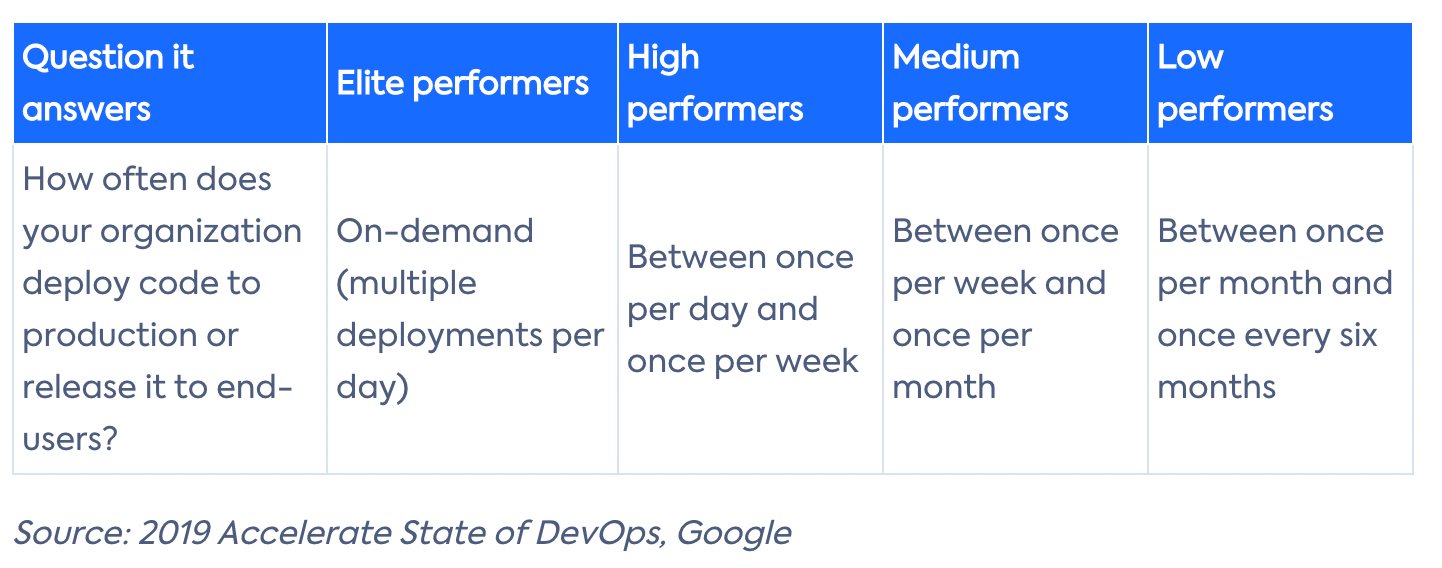
Deployment Frequency refers to the frequency of successful software releases to production.
In general, it's normal to have one deployment per week, but that's not the only option, it can go up to 7 per day for high-performing companies. For example, mobile apps deploy once or twice per quarter, while SaaS solutions can deploy multiple times per day.
How to measure deployment frequency?
Usually, deployment frequencies are the easiest to read, it's just the number of deployments per day. You can get that from your CD (continuous deployment) pipeline on GitHub.
You can check out this repo for more information.
 samsmithnz
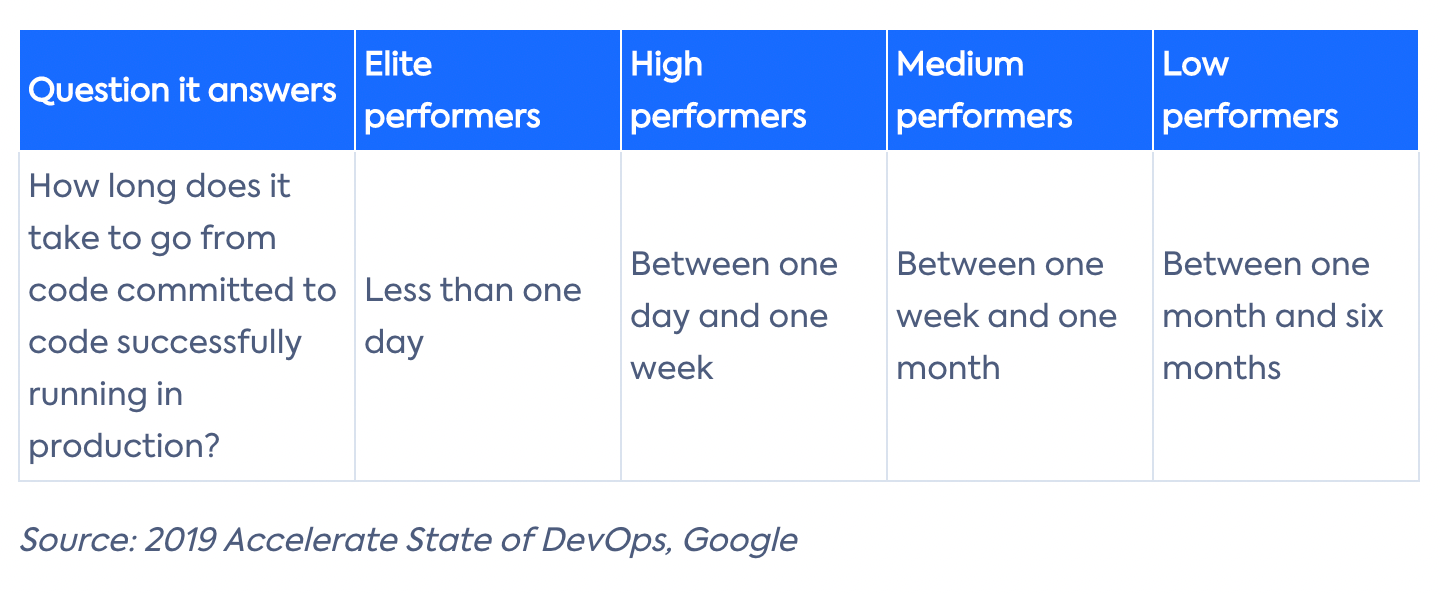
Lead Time for Changes
This is one of the more interesting metrics.
Lead Time for Changes measures the velocity of software delivery. It shows us the DevOps team's cycle time and find out how an increase of requests is handled. The lower this metric is, the more efficient a DevOps team is in deploying code.
Difference between Lead Time for Changes, Lead Time, and Cycle Time

Some people confuse the three terms, so let's debunk this once and for all.
Lead time measures how long it takes for a feature request to be submitted to it being satisfied.
Cycle Time measures the time it takes for your team to complete work items once they have been actively working on them.
Lastly, I want to add that Lead Time for Changes is an approximation. It's not perfect but its best advantage is that it's the easiest to measure by focusing on the CI/CD pipelines.
How to measure Lead Time for Changes?
The formula for lead time for changes is:
median(deployment timestamp - commit timestamp)
Where the commit time is the time when the code was committed to the repository and deployment time is when your code is deployed to production.
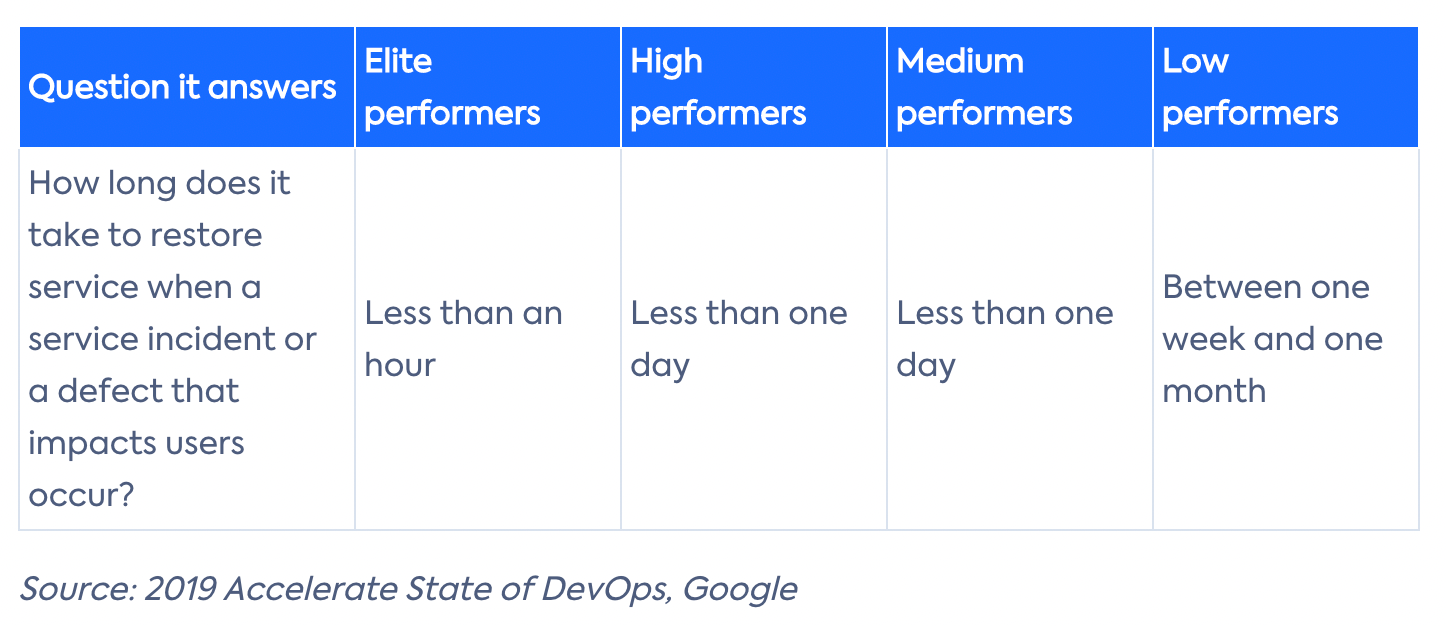
Mean Time to Recovery
The Mean Time to Recovery is the time it takes for a system to go back up after an outage. All systems will eventually fail, so the time it takes to get back up matters.
If a company has a short time to recover then management feels more comfortable with more risk-taking and innovating. In return, this creates a competitive advantage and improves business revenue
This metric helps with building more robust systems, as it encourages developers to think more in advance.
How to Measure Mean Time to Recovery?
The formula for Mean Time to Recovery is:
average(incident resolved timestamp - incident created timestamp)
This one is pretty simple, you just take the average time between a bug report and the moment the bug fix is deployed.
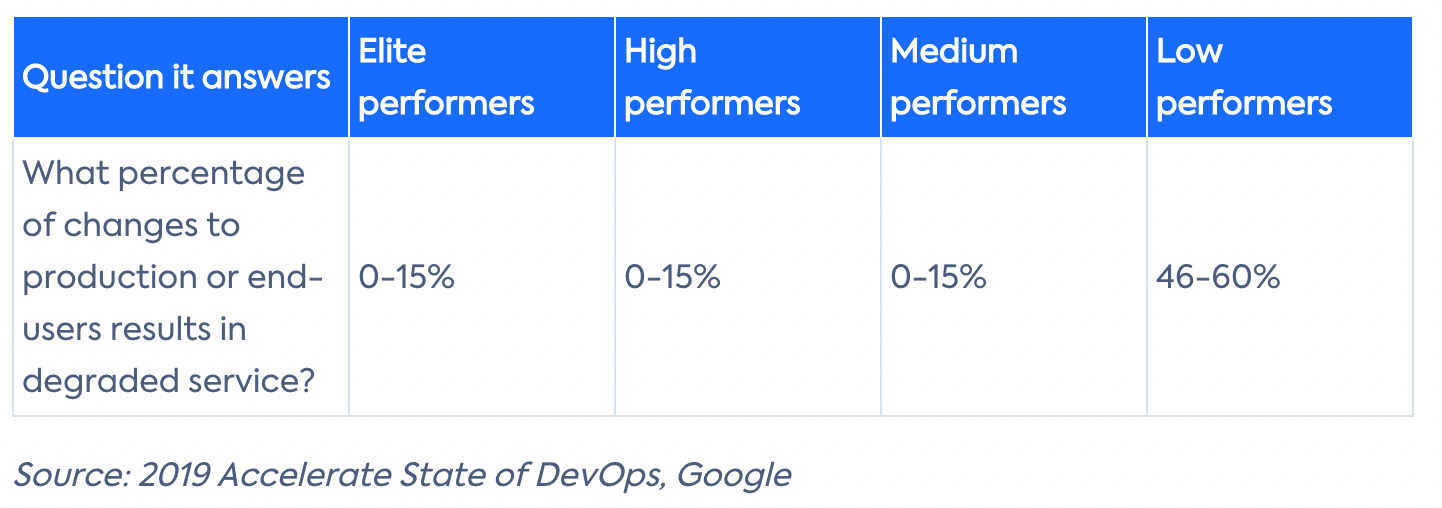
Change Failure Rate
Change Failure Rate measures the percentage of changes that were made that resulted in incidents, rollbacks, or any type of production failure.
In a nutshell, it's the measure of quality and stability. Over time this metric will show us insight as to how much time is spent on fixing bugs vs delivering new code.
How to Measure Change Failure Rate?
The formula for Change Failure Rate is:
number of deployments that caused incidents / total number of deployments
Change Failure Rate is calculated by counting the number of deployment failures and then dividing by the total number of deployments.
Causes of Poor DORA Metrics
There can be many reasons why your metrics are poor but these are the most common ones.
- Large code changes at once.
- Having poor code quality, which leads to difficulty in maintainability and more complex tests.
- Not having clear requirements or a poor definition of ready.
- Inefficient development process (blocks, dependencies, etc...)
- Bottlenecks
- Complex routes to production.
- Not having automated tests.
- Performing infrastructure changes that are not reusable.
- Leverage infrastructure and application configuration as code.
How to Improve your DORA Metrics
Some general things that will help your metrics include:
- Implement CI/CD with the best practices.
- Keep changes modular and small.
- Reduce technical debt.
- Automate everything, things such as tests, code reviews and release trains.
Benefits of DORA Metrics
The three main benefits of measuring DORA metrics are:
- Decision making — Tracking performance with the help of DORA metrics, lets DevOps teams with making better decisions, this is also called data-driven decision making.
- Delivering value — DORA metrics play a big role as they show what kind of value is delivered to the customer and what performance level is necessary to reach desired business outcomes. Thus, once DevOps teams use DORA metrics, they usually see an increase in value over time.
- Virtuous cycle — When performance is measured, there is a big chance it will be gamed. This means that people who feel responsible for a certain metric will adjust their behaviour to improve the metric on their end. aka ownership leads to more quality.
Limitations of DORA Metrics
Measuring DORA metrics is sometimes not that simple.
Challenges can arise which include:
- Decentralized Data – Data is scattered in different sources.
- Data extraction – Data is only available in raw format.
- Data transformation – Data needs to be transformed and combined into suitable units.
- Speed vs. Stability – Singular metrics should be put into context. A high Change Failure Rate could indicate that there is poor quality control while a high Deployment Frequency does not say anything about the quality of the code or product.
Beyond DORA Metrics
These metrics are definitely a step in the right direction but some people say that they are imperfect and incomplete. I have included below some other metrics that we think are good to track to get a better picture of your engineering team.
- Onboarding Time — By measuring the amount of time it takes for a developer to make their first commit from being added to a Git organisation, you can measure how quickly they are able to get onboard to your development stack and start being productive. Fast onboarding time optimises for flow allows developers to get up and running with minimal frustration.
- Full Resolution Time (for bugs) — By measuring the time it takes an engineering team to fully resolve a bug after it has been reported, you can ensure you are optimising for an outstanding customer experience. Unlike MTTR metrics, Full Resolution Time accounts for the fix time of all customer-facing bugs instead of just those that cause an incident (however that is defined for your organisation).
- Developer Satisfaction — Using Developer Satisfaction or Developer Net Promotor Score surveys, you are able to ensure your developers are satisfied with your development stack and identify areas for improvement. This helps ensure that your developers aren’t just able to ship work fast and safely, but are also satisfied with their developer platform.
Conclusion
In this article, we have learned about DORA metrics and why it's important to track them. In conclusion, I just want to quickly summarise the four main metrics:
- Deployment Frequency – Refers to the frequency of successful software releases to production.
- Change Lead Time – Time from the first commit to a change (i.e. Pull Request) being deployed into production.
- Change Failure Rate – The percentage of deployments causing a failure in production.
- Mean Time to Recovery – How long it takes to recover from a failure in production.
Thanks for reading.
References
 LeanIX GmbH
 Catarina Gralha
 Catarina Gralha
 Catarina Gralha
 Junade Ali
No spam, no sharing to third party. Only you and me.
Member discussion